My impact on a SaaS plataform as a solo designer
A three-module enterprise platform redesign for Latin America's leading innovation consultancy — streamlining task management, enabling AI-powered strategic diagnostics, and cutting navigation time in half.
- Role
- Product Designer
- Client
- Innoscience / InnoUP
- Website link
- innoscience.com.br
Main Problem
Innoscience's internal platform had grown organically over years. Teams juggled disconnected tools for project tracking, strategic diagnostics, and daily navigation — burning hours on friction instead of innovation.
Scattered Project Visibility
Sprint tasks, time logs, and project status lived in separate tools. Managers spent more time chasing updates than making decisions.
Manual Strategic Diagnostics
Innovation assessments relied on spreadsheets and tribal knowledge. No structured framework existed to diagnose client maturity or generate actionable recommendations.
Navigation Friction
The existing sidebar required multiple clicks and full page reloads to reach common destinations. Users averaged 4+ clicks for routine tasks.
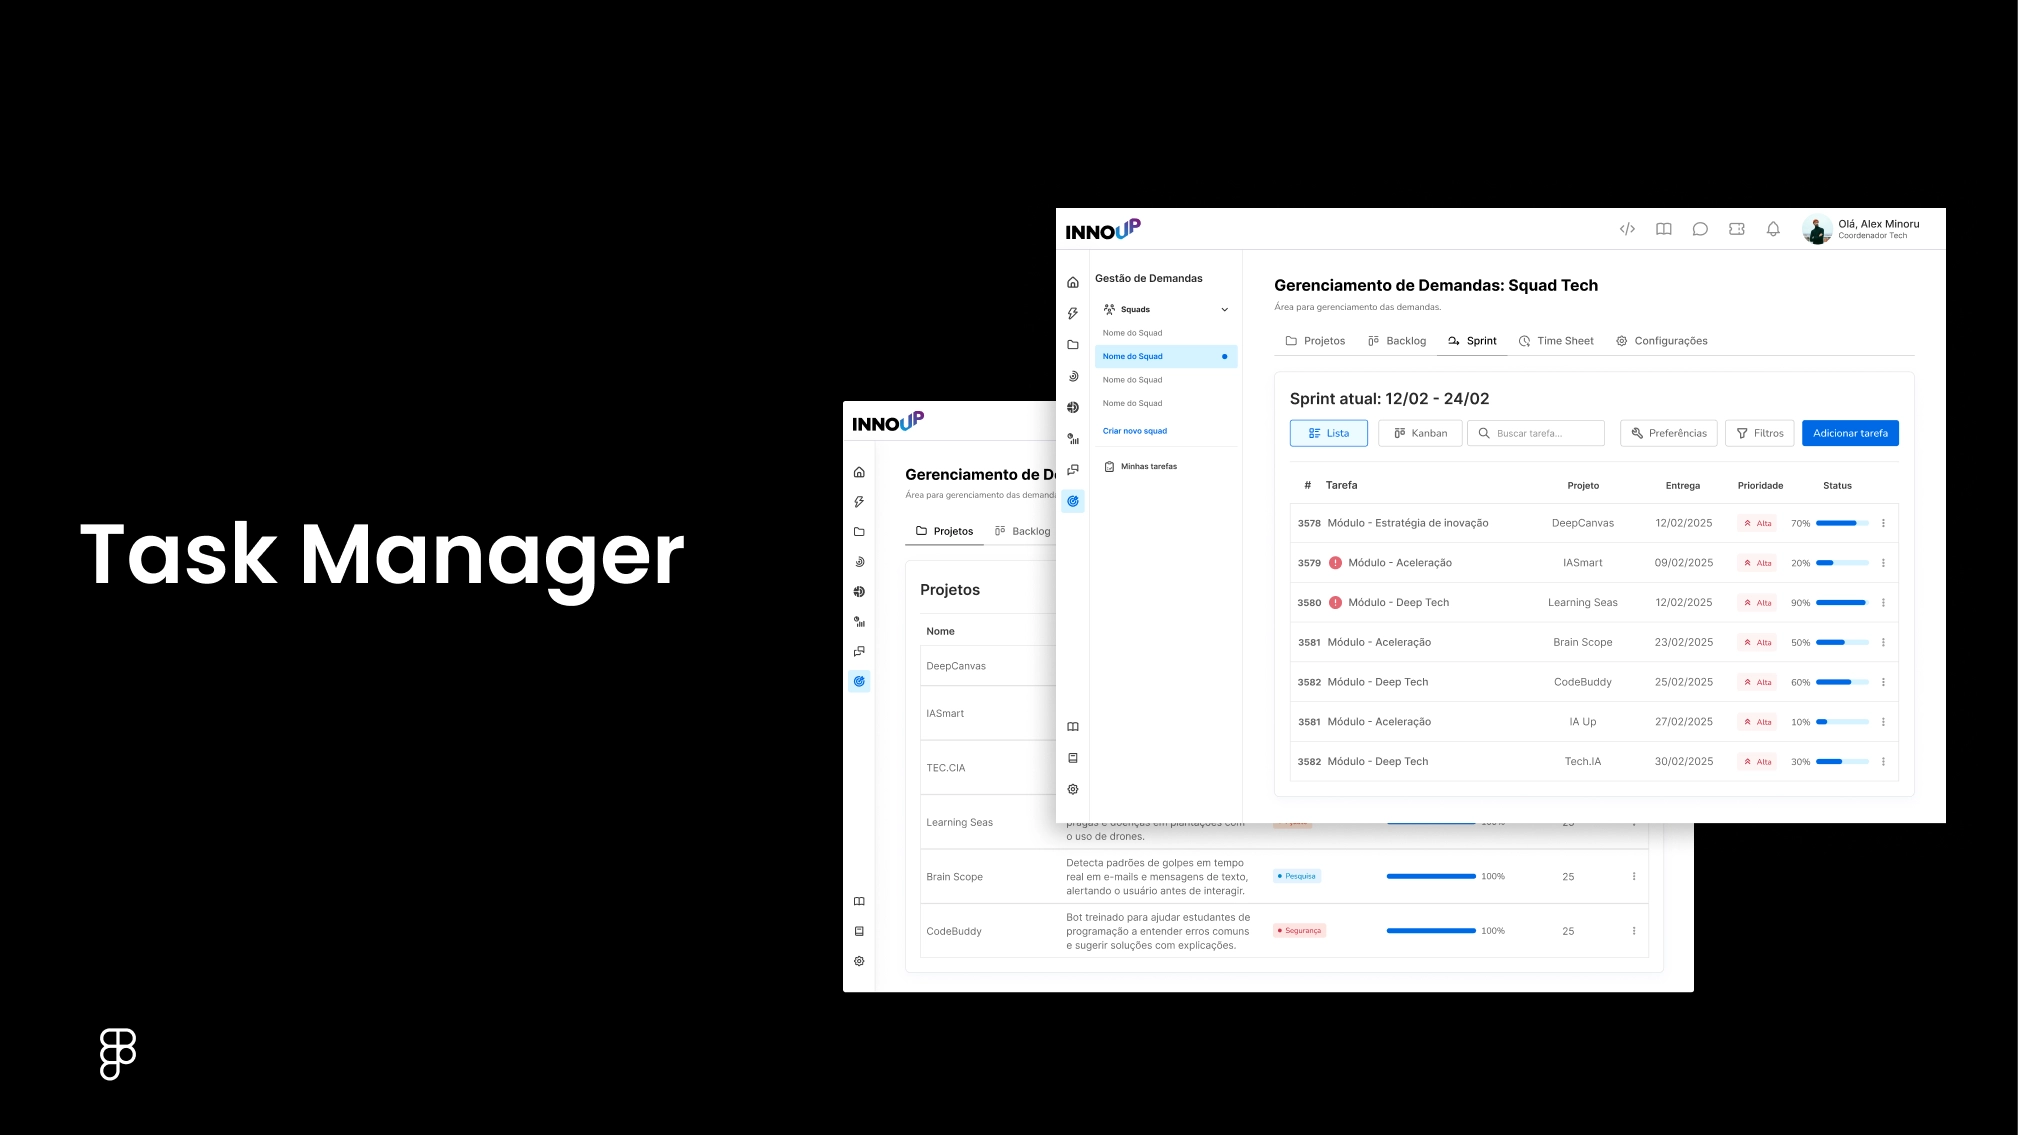
Module 01
Task Manager
Unified project tracking from sprint planning to time logging
Teams tracked work across spreadsheets, chat threads, and a basic legacy tool. Sprint status was invisible to leadership, and time logging was an afterthought — making resource planning nearly impossible.
Projects View
Table-format overview of all active projects with real-time progress bars, priority tags, and health indicators for fast scanning.
Sprint Management
List and Kanban toggle for sprint tasks, color-coded by priority with drag-and-drop reordering across status columns.
Task Detail
Consolidated view housing subtasks, file attachments, comments, and integrated time logs — one source of truth per task.
Timesheet
Day-by-day time logging aligned to sprint cycles, replacing manual spreadsheet entries with a scrollable calendar interface.
Performance Dashboard
Team-level widgets tracking hours logged, task completion rate, and time distribution by project and program.
35% faster sprint delivery
Centralizing task and time data eliminated status meetings and gave leadership real-time project visibility across all squads.
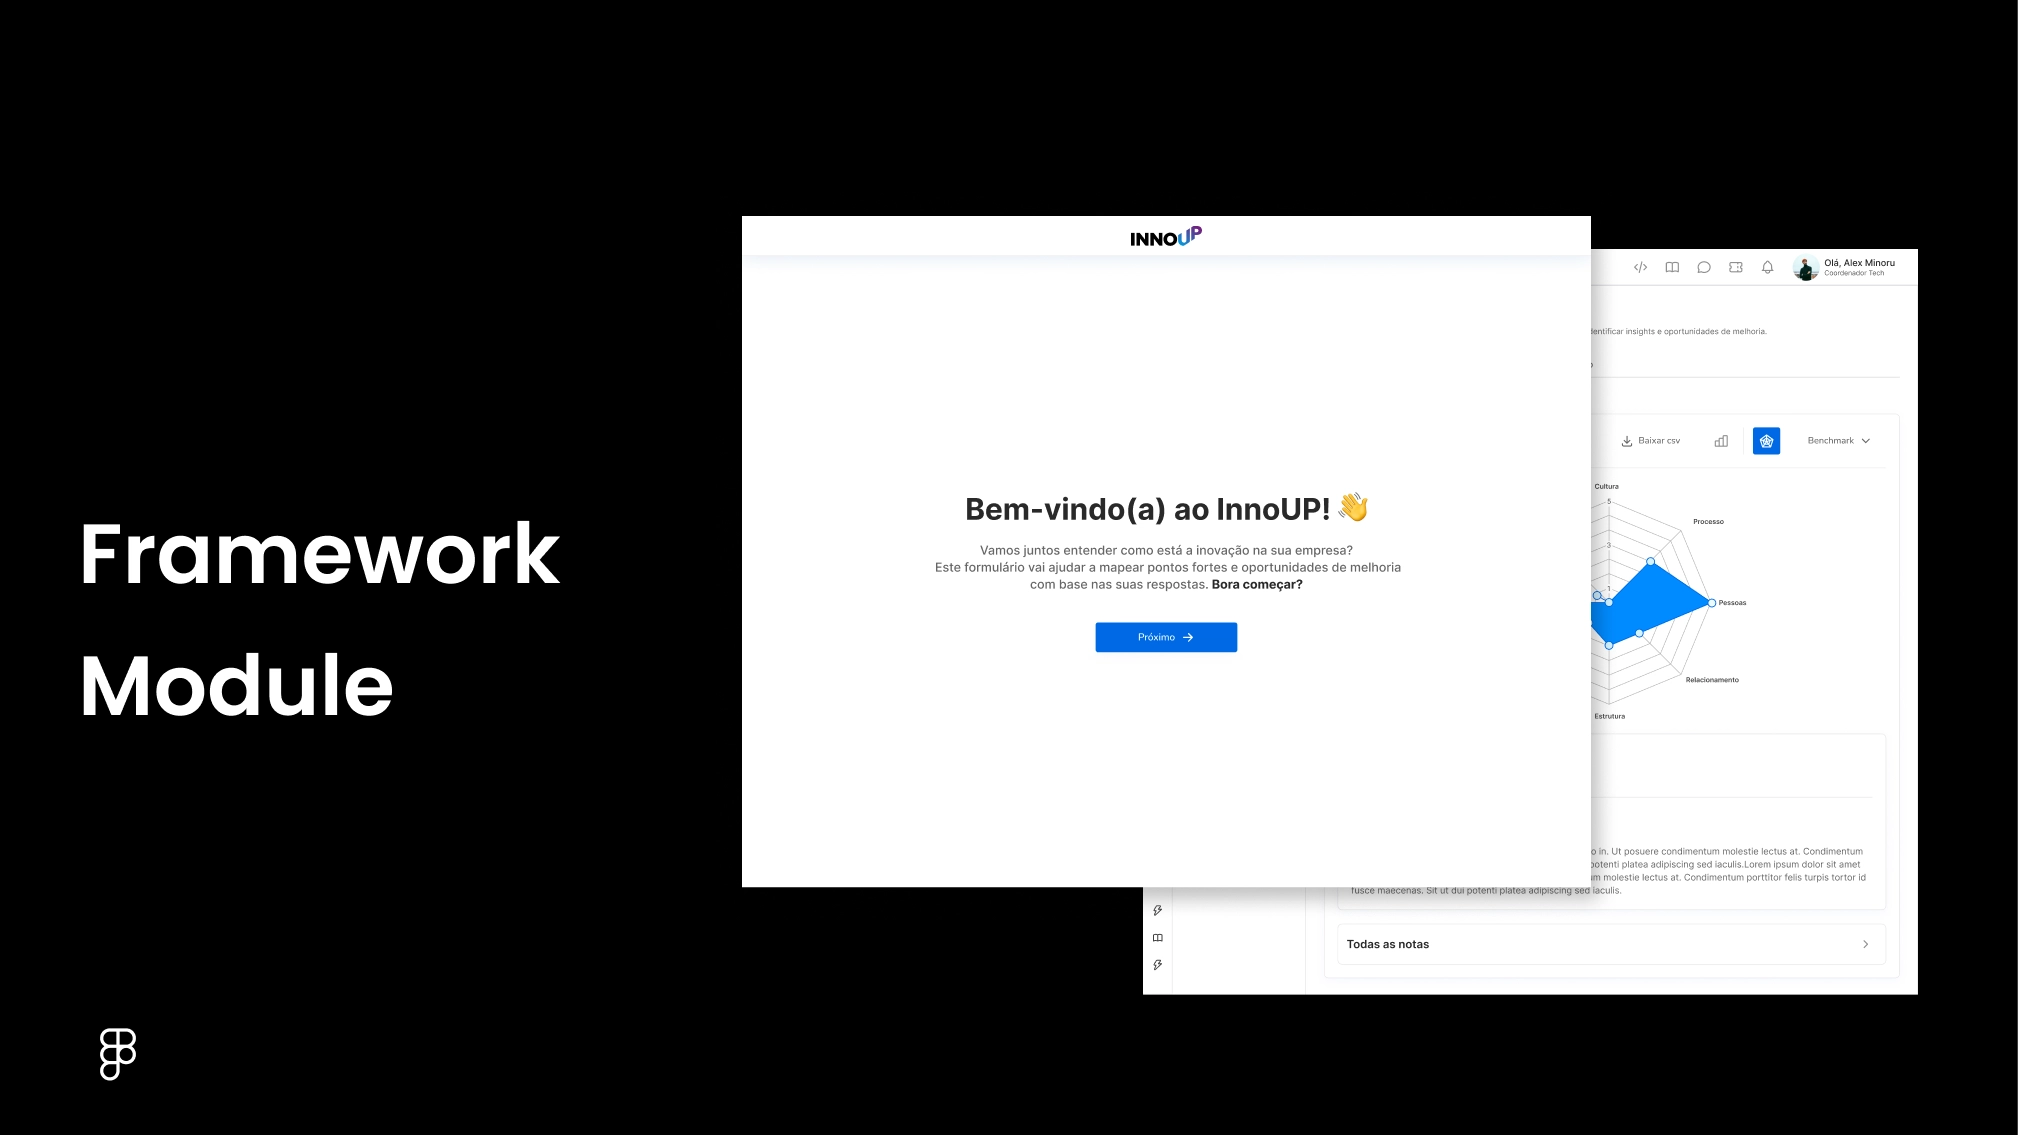
Module 02
Strategic Innovation Framework
AI-powered diagnostic tools replacing spreadsheet assessments
Consultants ran innovation maturity assessments using static spreadsheets. Results were inconsistent, analysis was manual, and recommendations depended entirely on individual consultant experience.
Form Builder
Custom diagnostic forms with configurable dimensions, weighted questions, and drag-and-drop section ordering for consultants.
Assessment View
Mobile-friendly, Typeform-inspired question flow that guides clients through diagnostics without friction or cognitive overload.
Progress Dashboard
Real-time dimension completion tracking so consultants know exactly where each client stands at any moment.
Radar Chart Visualization
Multi-dimensional diagnostic results rendered as interactive radar charts for clear innovation maturity mapping.
AI Recommendations
Steve, InnoUP's AI engine, analyzes diagnostic data and generates tailored strategic guidance — turning raw scores into actionable next steps.
3× faster diagnostic turnaround
Structured data collection and AI-generated insights replaced weeks of manual analysis with near-instant, consistent recommendations.
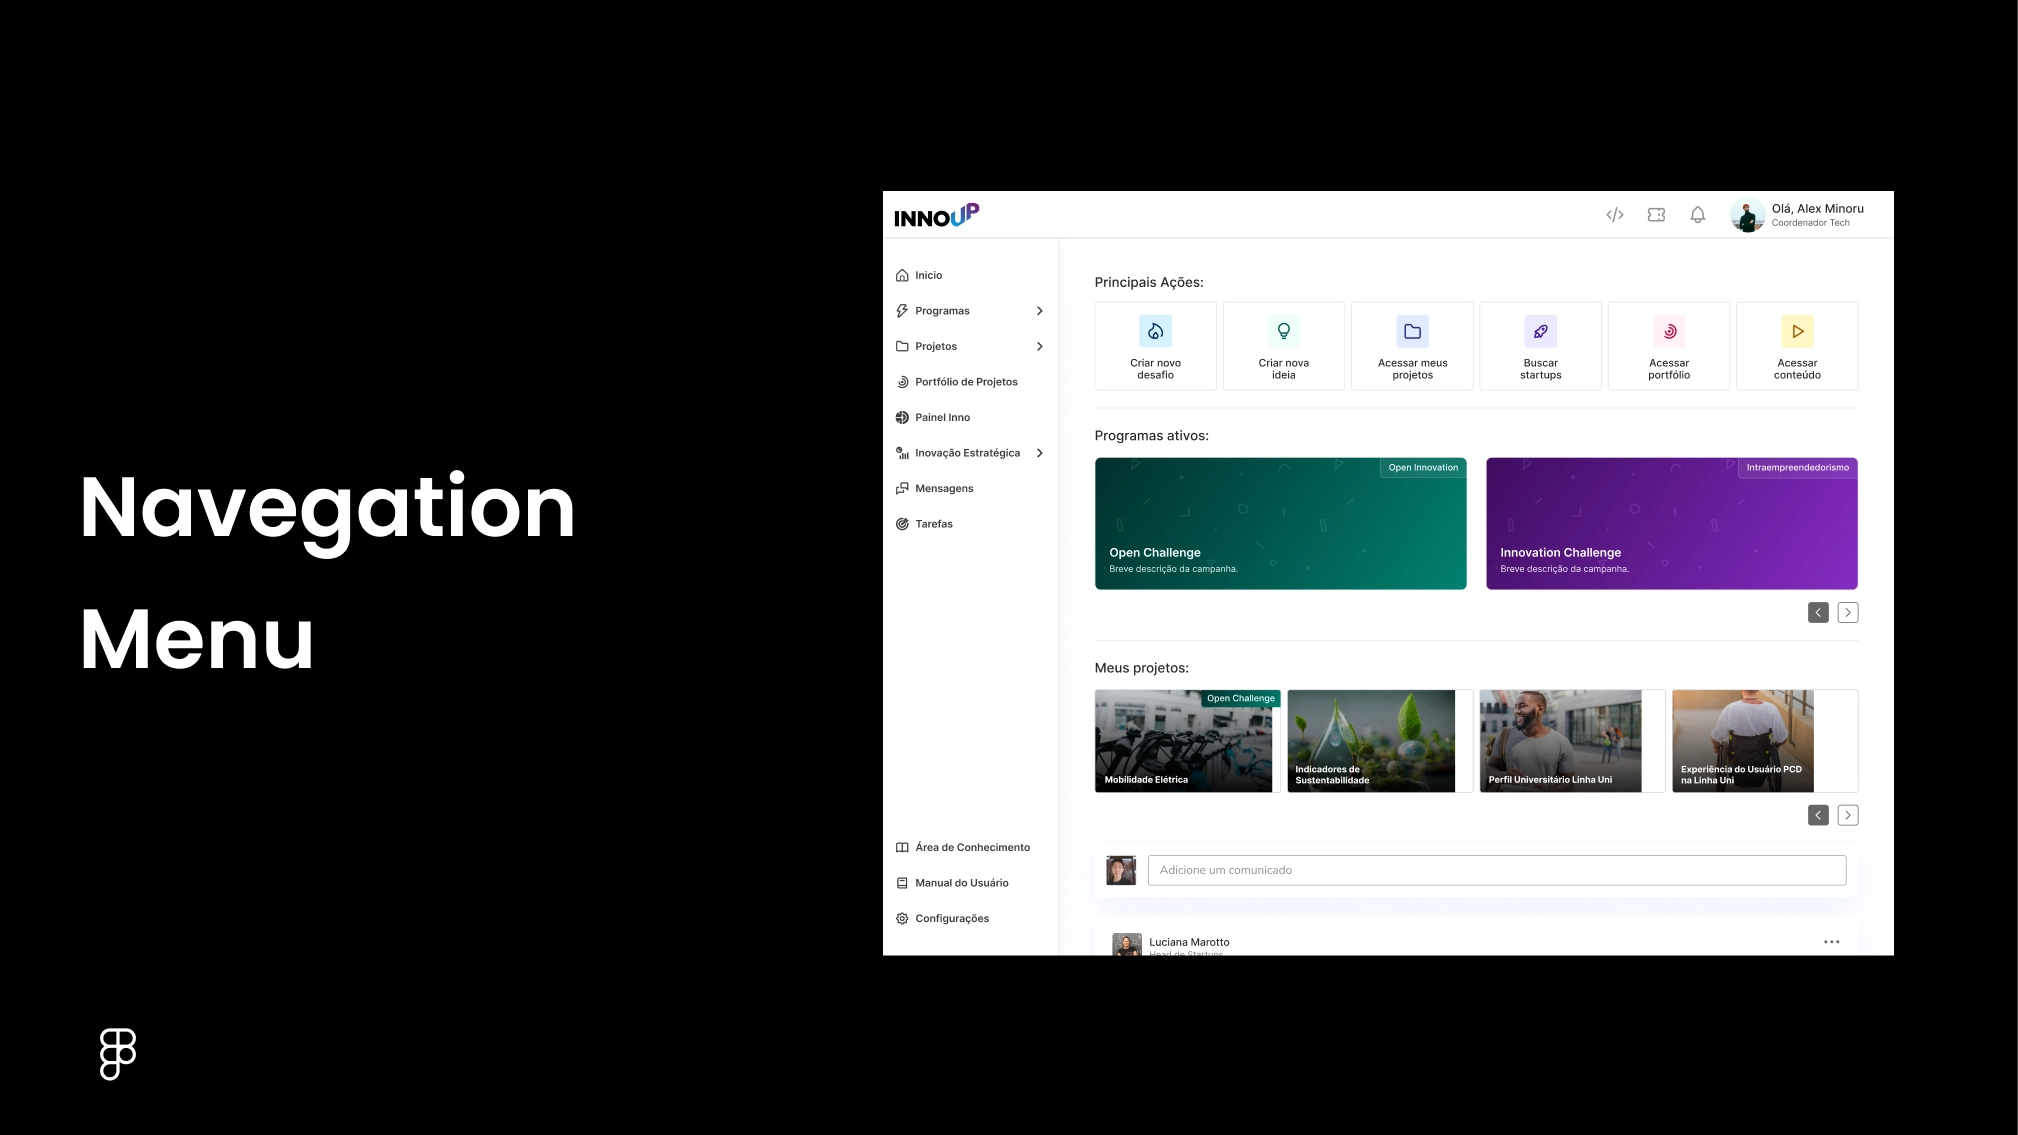
Module 03
Navigation Redesign
Research-driven information architecture overhaul
The existing navigation required full page reloads for every destination. Deeply nested menus meant users routinely got lost, and new team members needed weeks to learn the platform's structure.
Hover-Activated Submenus
Side navigation with instant hover-reveal submenus — eliminating click-wait-click patterns entirely.
Contextual Wayfinding
Persistent breadcrumbs and section indicators so users always know where they are within the platform hierarchy.
Research-Driven IA
Card sorting and tree testing with internal teams validated the new structure before a single pixel was designed.
50% reduction in navigation time
Hover interactions and a flattened hierarchy cut average task-to-destination from 4+ clicks to 2, validated through usability testing.
Results
The redesigned platform unified three previously disconnected workflows into a single coherent product. By end of 2024, internal satisfaction hit 99% — reflecting the cumulative impact of streamlined project management, intelligent diagnostics, and frictionless navigation.